The MND Economy Index™ for July 2026
Welcome to the fifth edition of the MND Economy Index™, part of the MND Intelligence™ suite of data products from Mexico News Daily.
The MND Economy Index™ is a 10-pillar, 19-indicator composite index that compiles a broad range of economic data into a single score between 0 and 100, giving Mexico News Daily readers a clear, accessible picture of how the Mexican economy is performing across multiple dimensions.
In the inaugural MND Economy Index™ article, published in late May, we not only analyzed the index score — 63.4 out of 100 — but also explained what the index is, why we developed it and how it works. Click here to read (or re-read) those explanations.
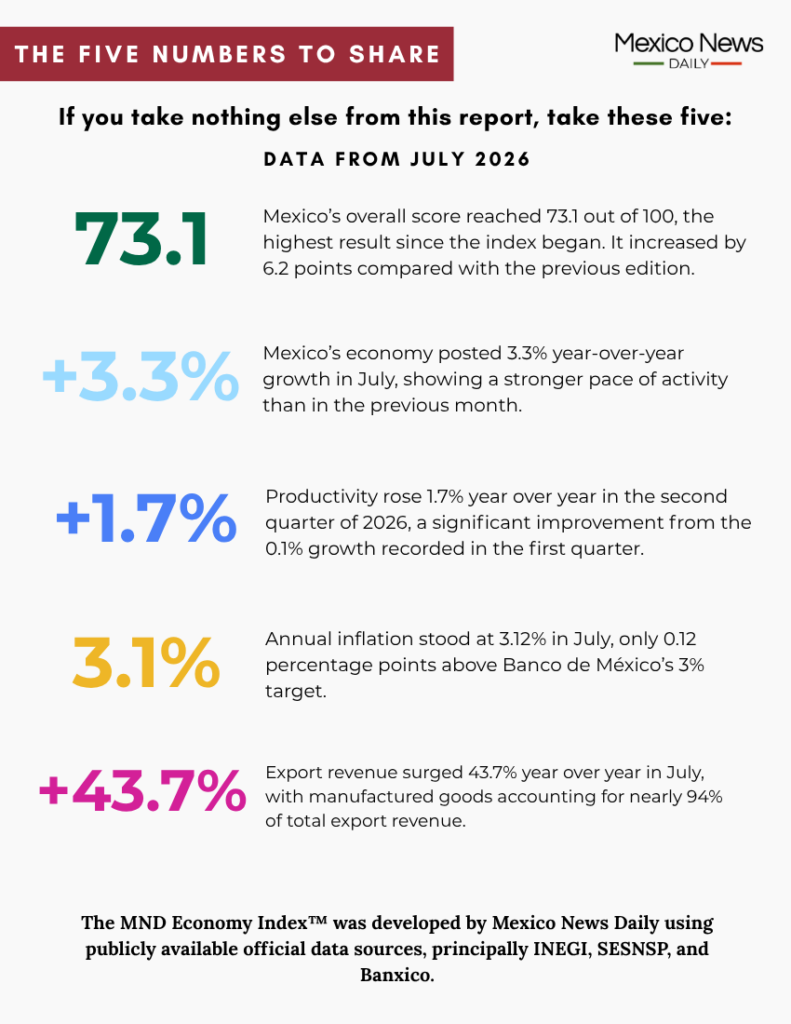
In this September edition of the MND Economy Index™ — which uses economic data primarily from the month of July — the index score is 73.1, a notable increase of 6.2 points compared to the previous score.
The score for July is easily the highest since we began publishing the MND Economy Index™, reflecting improvements in several of its component pillars.
Before we look more closely at the latest index result, here is a short guide to what the overall index score means.

- 85–100: Exceptional — the economy performing at a high level across nearly all indicators.
- 75–84: Strong — strong broad-based performance with only minor areas of concern.
- 60–74: Above neutral — meaningful strengths, but with notable room for improvement.
- 50–59: Mixed — passing marks overall, more indicators above benchmark than below.
- Below 50: Broad underperformance — more indicators below benchmark than above.
The September edition of the MND Economy Index™ (based mainly on July data)
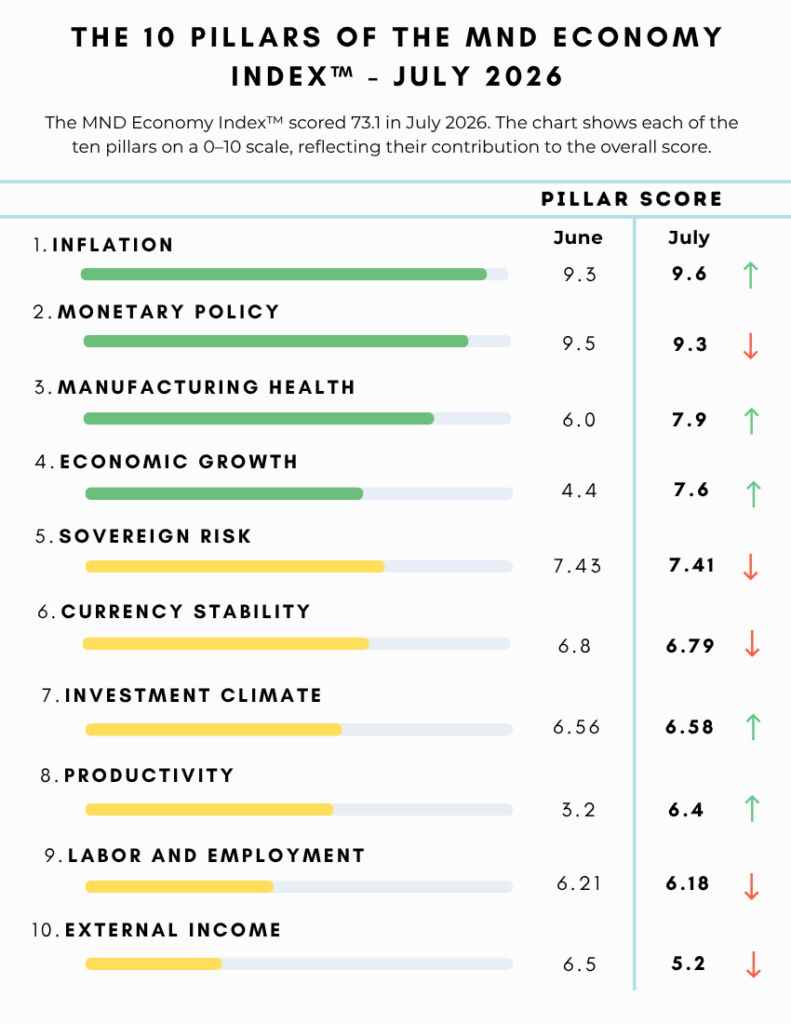
As noted above, the MND Economy Index™ score for this September edition is 73.1, an increase of 6.2 percentage points compared to the previous score. Below you will see the score for each of the ten pillars that make up the index, expressed out of 10 to reflect each pillar’s exact contribution to the final composite score.
Pillars are color-coded using a traffic light system: green (a score above 7.5) indicates strong performance; yellow (5.0–7.5) signals decent performance but with room for improvement; and red (below 5.0) flags a pillar that is falling short of its benchmark. Where a pillar score has improved compared to the previous month, an upward arrow appears alongside its corresponding traffic light; a downward arrow indicates a deterioration; and a pause symbol denotes no change.
As you’ll see below, scores for five of the ten MND Economy Index™ pillars increased in July compared to the previous month. Scores for the other five pillars declined. Collectively, the increases were more significant than the decreases, allowing the index score to rise.
It is noteworthy that, for the first time since we began publishing the MND Economy Index™ on a monthly basis, none of the pillars registered a red-light score.
🟢 ⬆️ INFLATION (9.68)
The score for this pillar increased to 9.68 in July from 9.33 in June. The inflation pillar thus replaced the monetary policy pillar as the largest contributor to the overall index score.
Annual headline inflation eased to 3.12% in July from 3.37% in June, causing an increase in the score for the current inflation component of the pillar. At 3.12%, the inflation rate was just 0.12 percentage points above the Bank of Mexico’s 3% target.
The score for the pillar component that considers the 12-month forward inflation forecast also increased as the Bank of Mexico anticipates an annual rate of 3.2% in the third quarter of 2027, which, of course, includes the month of July. The central bank is predicting a slightly higher inflation rate of 3.3% in the second quarter of next year. We used the Bank of Mexico’s Q2 2027 forecast for the previous edition of the MND Economy Index™ as it corresponded to the month of June.
The inflation pillar score is set to decline in the next edition of the MND Economy Index™ as inflation increased in August to reach an annual headline rate of 3.26%.
🟢 ⬇️ MONETARY POLICY (9.32)
The score for this pillar declined to 9.32 in July from 9.57 in June.
The Bank of Mexico’s benchmark interest rate remained at 6.50% in July after the central bank’s board voted to keep it at that level at a monetary policy meeting in late June. Therefore, there was no change in the interest rate component of the pillar score.
The deterioration in the pillar score was due to an increase in Mexico’s real interest rate in June — i.e., the Bank of Mexico’s benchmark interest rate minus the annual headline inflation rate. The real interest rate in July was 3.38%, a reading 0.68 points above the 2.7% neutral midpoint. The real interest rate in June, at 3.13%, was closer to the neutral midpoint than the reading in July.
🟢 ⬆️ MANUFACTURING SECTOR HEALTH (7.9)
The score for this pillar increased in July, rising to 7.9 from 6.9 in June.
The exports component of the pillar remained at the maximum score due to a 43.7% annual increase in export revenue in July, well above the 16.7% threshold needed for a perfect ten. Official data shows that almost 94% of Mexico’s export revenue in July came from the shipment abroad of manufactured goods.
The increase in the overall pillar score was due to 1.6% annual growth in manufacturing output in July. The year-over-year gain represented a significant improvement from the 2.4% decline in June.
🟢 ⬆️ ECONOMIC GROWTH (7.6)
The score for this pillar increased to 7.6 in July from 4.4 in June. The large increase in the score allowed economic growth to move from being a red light pillar to a green light pillar in the space of a single month.
The increase was due to a significantly higher annual economic growth rate in July. The annual growth rate in July was 3.3%, according to final data published by INEGI last week, whereas the rate in June was 1.7%.
The solid economic growth performance in July (month-over-month growth was 1.4%) came after Mexico’s economy expanded 1.9% in annual terms in the second quarter of the year. Annual growth in Q1 was just 0.4%.
🟡 ⬇️ SOVEREIGN RISK (7.41)
The score for this pillar was 7.41 in June, down slightly from 7.43 in June.
The score for the sovereign credit ratings component of the pillar remained unchanged in July, as there were no month-over-month changes to the Mexico ratings of Moody’s (Baa3/stable); S&P (BBB/negative); and Fitch (BBB-/stable).
The slight decline in the overall pillar score was due to a modest widening in Mexico’s 5-year credit default swap spread. The credit default swap spread was 87.19 basis points at the end of July, up from 86.87 basis points at the end of June. The increase reflected a slight rise in the market-implied cost of insuring against a Mexican sovereign default.
🟡 ⬇️ CURRENCY STABILITY: (6.79)
The score for this pillar declined slightly to 6.79 in July from 6.8 in June.
The standard deviation of daily exchange rate movements decreased to 0.40% in July from 0.49% in June, leading to a slight increase in the score for that component of the pillar.
The decrease in the pillar score in July was due to a lower spot rate score. The score for that component declined because the peso strengthened against the US dollar in July to trade at 17.32 to the greenback at the end of the month, an appreciation of 1% compared to the end of June.
The exchange rate was thus more distant from the index’s 19.00 USD:MXN baseline, which is based on the 2025 average rate. This pillar penalizes significant deviation from the 19.00 USD:MXN baseline in either direction, recognizing that a peso that has strengthened too far from this benchmark can erode export competitiveness and reduce the purchasing power of remittances, just as a weakening peso raises import costs.
🟡 ⬆️ INVESTMENT CLIMATE (6.58)
The score for this pillar increased slightly to 6.58 in July from 6.56 in June.
The increase was due to higher annual growth on the S&P/BMV FIBRAS Total Return Index, which tracks the performance of Mexico’s listed real estate investment trusts. The index grew 27.4% annually to the end of July, up from a 27.1% year-over-year increase at the end of June.
The score for the foreign direct investment component of the pillar remained steady as the latest available data is still that published by the Economy Ministry in late August. That data shows that foreign direct investment in Mexico increased 2.1% annually in the first six months of 2026 to reach a record high $34.96 billion. Annual FDI growth of 25% is required for a perfect score in that component of the investment climate pillar.
🟡 ⬆️ PRODUCTIVITY (6.4)
The score for this pillar increased to 6.4 in July from 3.8 in June.
Data published by the national statistics agency INEGI on Sept. 10 showed that the IGPLE — INEGI’s quarterly productivity measure — increased 1.7% annually in the second quarter of 2026. That level of productivity growth was significantly stronger than the +0.1% reading in the first quarter of 2026.
Thus, the pillar score increased 2.6 points in the space of a month.
INEGI will publish productivity data for the third quarter of 2026 in early December. Therefore, the score for the productivity pillar won’t change in the October and November editions of the MND Economy Index™.
🟡 ⬇️ LABOR AND EMPLOYMENT (6.18)
The score for this pillar decreased to 6.18 in July from 6.21 in June. Scores for two of the pillar’s three components increased, but the overall labor and employment score still edged down because the decline in the formal-employment component outweighed the combined gains in wage growth and informality.
In July, there was a 1.5% annual increase in the number of people in formal sector jobs, down from 2% growth in June. Therefore, there was a decrease in the score for that component of the pillar.
Nominal wages rose 6.7% year-on-year in June — up from 6.4% in June.
Year-over-year growth in Mexico’s informality rate was 0.1 points, down from an annual increase of 0.2 points in June. In July, 56.2% of all Mexican workers worked in the informal economy. Lowering the informality rate is a major challenge for the Mexican government.
🟡 ⬇️ EXTERNAL INCOME (5.26)
The score for this pillar declined in July, falling to 5.26 from 6.52 in June.
Incoming remittances increased 3% year-on-year — a decrease compared to the 4.2% annual growth in June.
Thus, the score for the remittances component of the pillar declined and moved further away from the 16.67% increase required for a perfect score.
A 1.3% year-over-year decline in tourism revenue in July was also a factor in the lower pillar score. The year-over-year decline in spending came after tourism revenue increased 5.9% annually in June, the month Mexico hosted most of its FIFA men’s World Cup matches.
The MND Economy Index™ trend
In the graph below you can see how the MND Economy Index™ score has changed over time.
We have now calculated a total of nine index scores in the period between March 2025 and July 2026. The difference between the lowest score (56.9 in March 2025 — predating the publication of the first MND Economy Index™ article) and the highest (73.1 in July 2026) is 16.1 points.
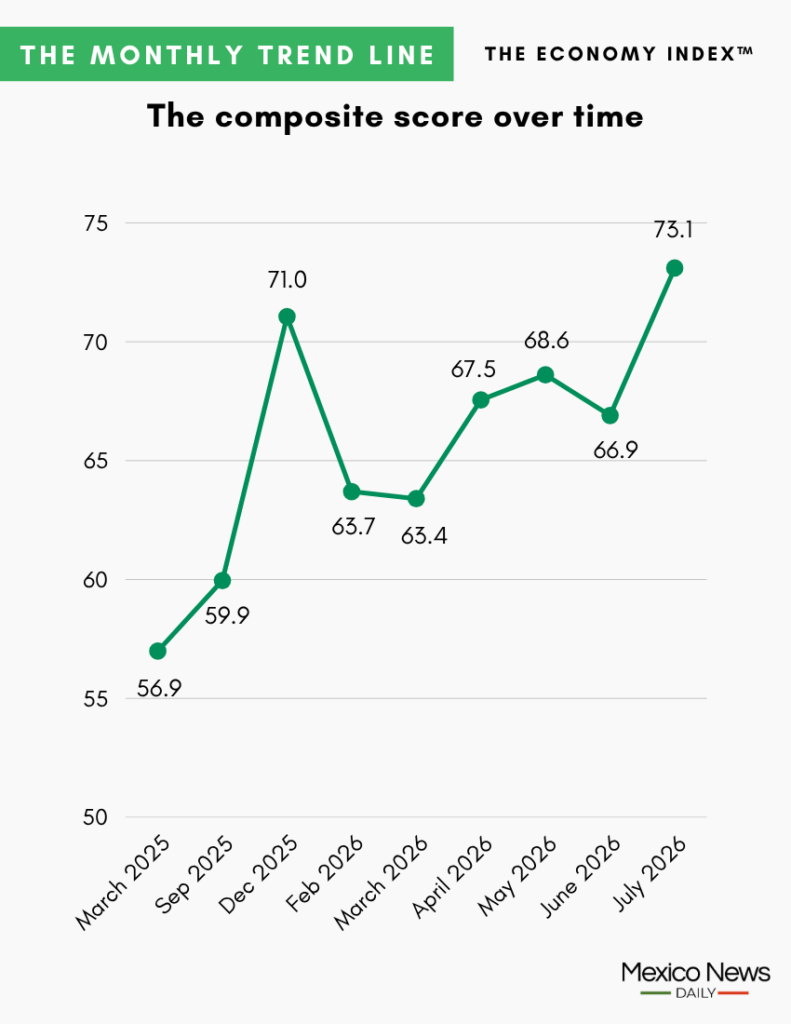
The much higher score in this edition of the the MND Economy Index™ indicates that Mexico’s economy is performing much better now than it was early in President Sheinbaum’s six-year term.
The improvement in the index score this year has also been notable, increasing almost 10 points between March and July.
KioskNews shows a cleaned-up reading view extracted from the publisher’s page — the original always lives on their site, not ours.