Mumbai’s air is ‘satisfactory’ and ‘unhealthy’. How can both be true?
On October 15, IQAir, a Swiss company that sells air purifiers and runs a widely quoted air-quality monitoring platform, placed Mumbai fifth among 122 of the world’s most polluted cities and first in India, one place above Delhi. On the same day, the Central Pollution Control Board (CPCB), the government’s pollution watchdog, classified Mumbai’s air as ‘satisfactory’.
The two readings have been at odds all month.
Mumbai’s air began deteriorating in the first week of October, after the monsoon withdrew early. Between October 1 and 23, the CPCB dashboard put the city’s air in the ‘unhealthy’ category on 11 days. But IQAir put it there on all 23. The disparity is also evident in the peak readings recorded by the two platforms. IQAir’s peak reading of AQI was 188, on October 17. The CPCB’s was 127, on October 18.
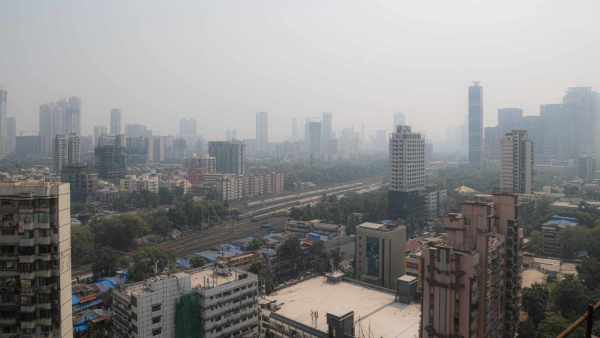 The skyline from Dadar on Saturday, shrouded in haze (Express photo by Akash Patil)
The gap is not a case of one agency getting it right and the other getting it wrong. Government agencies and private platforms use different monitoring networks and different AQI scales, and in Mumbai, the weather and the city’s geography complicate both.
Mumbai is a peninsula, with the Arabian Sea on three sides and hills and ridges that shape how wind moves through it and how pollutants disperse. Dense population, heavy traffic and concentrated construction mean pollution varies sharply from one part of the city to another. Where you put a sensor matters more here than in most cities.
How Mumbai’s air is measured
The Maharashtra Pollution Control Board (MPCB) monitors Mumbai’s air through 26 Continuous Ambient Air Quality Monitoring Stations or CAAQMS. Each is a weatherproof cabin on an open plot, with sampling inlets and weather sensors mounted on it. The station draws in outdoor air and measures six pollutants: PM2.5, fine particles that penetrate deep into the lungs; PM10, larger particles from road dust and construction; nitrogen dioxide, from vehicle exhaust; sulphur dioxide, from fuel and industry; ozone, which forms in sunlight; and carbon monoxide, from incomplete combustion.
Most pollutants are assessed on 24-hour averages, carbon monoxide and ozone on eight-hour averages. The readings from all 26 stations are then averaged to produce one AQI figure for Mumbai, classified as Good, Satisfactory, Moderate, Poor, Very Poor or Severe.
Private platforms work differently. They combine readings from government-approved stations with low-cost sensors: portable boxes, most with a small fan to draw in air, that can be installed almost anywhere and moved easily. Most of them measure only PM2.5 and PM10. IQAir has six stations in Mumbai. One is a government-approved CAAQMS. Five are low-cost sensors.
Story continues below this ad
Avinash Dhakane, additional municipal commissioner and head of the environment department at the Brihanmumbai Municipal Corporation (BMC), said the CAAQMS network was built to measure ambient air quality, the concentration of pollutants in the open atmosphere where people live, work and breathe. Low-cost sensors, he said, typically measure conditions in their immediate surroundings.
“Therefore, if a sensor is installed near a busy road or a bakery, its readings may be higher than those recorded by a CAAQMS located elsewhere. CAAQMS are equipped to monitor multiple pollutants and provide measurements representative of the larger area around the station, which are then used to calculate the AQI,” Dhakane told The Indian Express.
In a written response to the Indian Express’s query on the types of monitors IQAir uses, a spokesperson said that the agency measures air quality by taking an average of the available, verifiably accurate monitoring stations, from all available sensors, regardless if they are low-cost sensors or government operated regulatory stations
Different benchmarks, different readings
The monitoring network is only half the explanation. The other half is how a pollutant concentration is turned into an AQI number.
Story continues below this ad
India assesses air under the National Ambient Air Quality Standards (NAAQS), notified in 2009. IQAir told The Indian Express it follows the AQI methodology of the US Environmental Protection Agency (EPA). The World Health Organization (WHO) sets its own health guidelines.
The gap is widest for particulate matter. The WHO’s 2021 guidelines recommend a 24-hour PM2.5 average of no more than 15 micrograms per cubic metre (µg/m³). India’s permissible limit is 60 µg/m³, four times that. For PM10, the WHO limit is 45 µg/m³, India’s is 100.
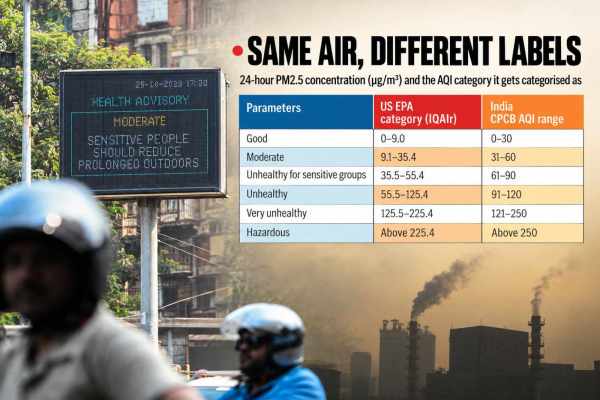
The scales themselves also differ. An AQI is a score, not a measurement. A monitor records how much PM2.5 is in the air, in micrograms per cubic metre. A formula then turns that concentration into a number on a scale, and the number gets a label such as ‘Good’ or ‘Poor’. The concentration at which one label gives way to the next is called a breakpoint. India sets its breakpoints far higher than the US does.
“The AQI scale for the US in particular has breakpoints. For example, a Good AQI of 0-50 is derived from a PM2.5 concentration of 0-9.0 ug/m3. India’s AQI scale categorises a Good AQI as a PM2.5 concentration of 0-30.0 ug/m3,” the IQAir response said.
Story continues below this ad
In other words, air with 20 µg/m³ of PM2.5 is ‘Good’ in India and ‘Moderate’ in the US. The same reading lands in a more serious category under the US scale, and the two AQI numbers cannot be compared without accounting for that.
“In every country, there are different rules for AQI assessments, which are modified over time. However, in India, the AQI measurement standards have remained unchanged since 2009, while other factors, such as vehicular density and the scale of industrialisation, which directly affect air quality, have increased substantially,” said Dr Gufran Beig, atmospheric scientist and chair professor at the National Institute of Advanced Studies in Bengaluru.
“Neither system is entirely right or wrong; both are necessary to build a robust air-quality monitoring system. While conventional CAAQMS are important for assessing ambient air quality in their surrounding areas, low-cost sensors can help identify pollution hotspots at the local level,” Beig told The Indian Express.
Humidity, heat and El Niño
Mumbai’s weather adds a third layer. High humidity can push up readings on certain sensors, because suspended particles absorb moisture and swell.
Story continues below this ad
“In Mumbai, average humidity levels remain around 70 per cent during winter. As a result, suspended particulate matter, including sulphates and nitrates, can absorb moisture and grow in size. The larger the particles become, the higher the readings recorded by certain sensors may be,” said Dr Sachchida Nand Tripathi, dean of the Kotak School of Sustainability at IIT Kanpur and a member of the steering committee of the National Clean Air Programme.
The weather also explains why this October has been bad. On October 16, Mumbai’s AQI crossed Delhi’s on IQAir’s readings. Delhi had intermittent rain in mid-October, Beig said, while Mumbai had a long dry spell and unusually high temperatures. Maharashtra, like much of India and South Asia, has seen deficient rain and intense heat this season, and weak winds have kept pollutants from dispersing.
“This year, Mumbai is experiencing an El Niño-influenced climate pattern. As a result, wind speeds have slowed considerably, while temperatures remain high and conditions humid. These factors are restricting air circulation and allowing pollutants to accumulate in the lower atmosphere, leading to a rise in pollution levels,” Beig said.
For a resident checking the air before a morning run, the two numbers answer different questions. The CPCB figure says what the city’s air is like on average, against a standard unchanged since 2009. The IQAir figure says what the air is like near one of its sensors, against a stricter standard.
KioskNews shows a cleaned-up reading view extracted from the publisher’s page — the original always lives on their site, not ours.