S&P 500 correlation with top stocks falls to lowest in at least 15 years

da-kuk/E+ via Getty Images
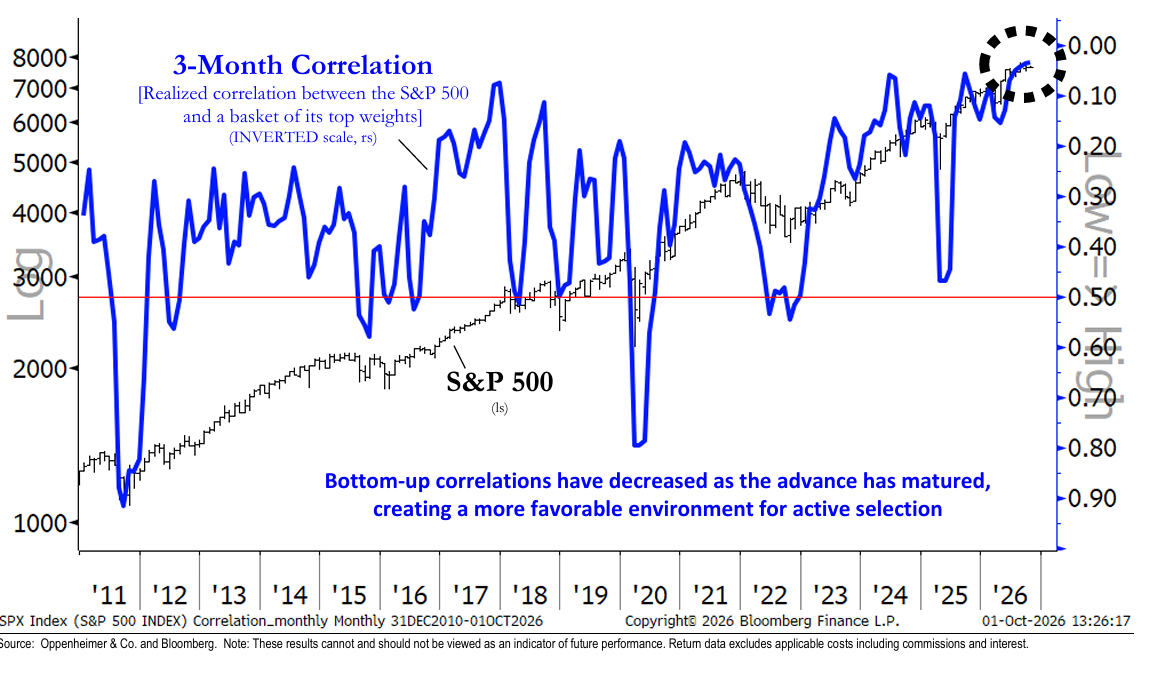
The three-month rolling correlation between the S&P 500 (SP500) and a basket of its largest constituents has fallen to its lowest level in at least 15 years, according to Oppenheimer & Co. technical analyst Ari H. Wald.
Oppenheimer said an unusually low correlation has historically been followed by a higher reversion, often during market declines. While the timing of such a correlated selloff is difficult, the firm said the risk is increasing as the current bull market enters its fifth year, the sixth-longest of the 24 cycles since 1932.
The chart showed the three-month realized correlation between the S&P 500 and a basket of its top-weighted stocks, plotted on an inverted scale, meaning lower correlation plots higher on the chart. A chart note says bottom-up correlations have decreased as the advance has matured, creating a more favorable environment for active selection.
Oppenheimer said the near-term backdrop remains favorable, while the ingredients for a more difficult 2027 are gradually falling into place.
Here is the chart:
BBG, Oppenheimer
Recommended For You


Create Your Free Account to Keep Reading
Get the confidence to navigate an uncertain market with free breaking news and stock alerts.
KioskNews shows a cleaned-up reading view extracted from the publisher’s page — the original always lives on their site, not ours.