Liquefaction map update shows several changes
BETTER DATA: Many readings from across Taiwan were added to the data used to generate the new map, the Geological Survey and Mining Management Agency said
By Jonathan Chin / Staff writer, with CNA


The classification of soil liquefaction risk at several areas near major population centers has changed — some for the better and some indicating greater danger — updates to a map released yesterday by the Geological Survey and Mining Management Agency showed.
Liquefaction risk classifications have changed in about 17 percent of the regions surveyed, agency Director-General Hsu Ming-hong (徐銘宏) told a news conference in Taipei, adding that the changes reflect improved data, not changes in the soil itself.
The map — which is available at https://liquefaction.gsmma.gov.tw/gsmma/Web/Map.aspx — shows areas designated as high, medium and low potential for liquefaction in Taipei, New Taipei City, Taoyuan, Hsinchu county and city, and Yilan County.
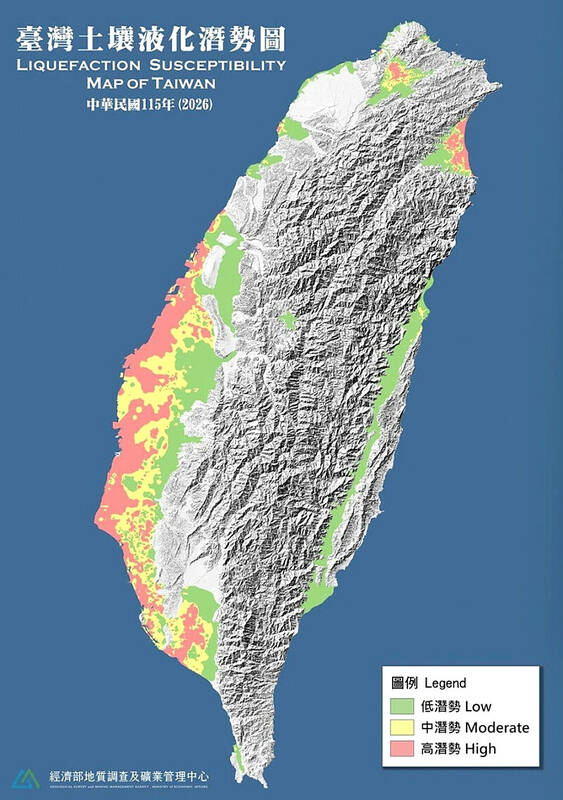
A map released yesterday shows soil liquefaction risk.
Photo courtesy of the Geological Survey and Mining Management Agency
Areas at high and low risk both decreased, with most shifting to medium potential, Applied Geology Division section head Chen Po-tsun (陳柏村) said.
Swathes of New Taipei City’s Banciao District (板橋) were redesignated as low risk, while portions of Hsinchu City’s North (北區) and Siangshan (香山) districts were redesignated as high-risk areas, Chen said.
The agency created a new layer on the map showing soft soil distributions to provide engineering agencies information on potentially dangerous soft soil that requires additional monitoring and specialized construction techniques if they are developed, Hsu said.
The government launched the map to enhance safety and transparency in the aftermath of the deadly 2016 earthquake centered in Kaohsiung’s Meinong District (美濃), Hsu said.
The agency is building the digital map to provide more data to facilitate land management, urban renewal and real-estate utilization, he said.
The latest survey investigated a larger area than its previous iterations, added new data derived from drilling and combined information gathered by soil liquefaction monitoring stations, he said.
“The soil liquefaction trend map does not show danger zones, but rather marks the strength of quakes that could liquefy the soil in a given area to help surveyors, architects and developers mitigate risks,” he said.
This year’s survey analyzed data from 11,731 boreholes across 909.8km2, a three-fold increase in bores providing data and about a 96km2 increase in areas investigated compared with the 2021 map, the agency said.
Ten operational soil liquefaction monitoring stations have been established, with one operating on a trial basis, a system that keeps tabs on changes to strata and aquifers during tremors, it said.
Three more updates covering Taiwan proper’s central, eastern and southwestern areas are planned for release as the agency gathers more data, it added.
KioskNews shows a cleaned-up reading view extracted from the publisher’s page — the original always lives on their site, not ours.