Dust, waste burning drove Delhi pollution before farm fires, crackers took over
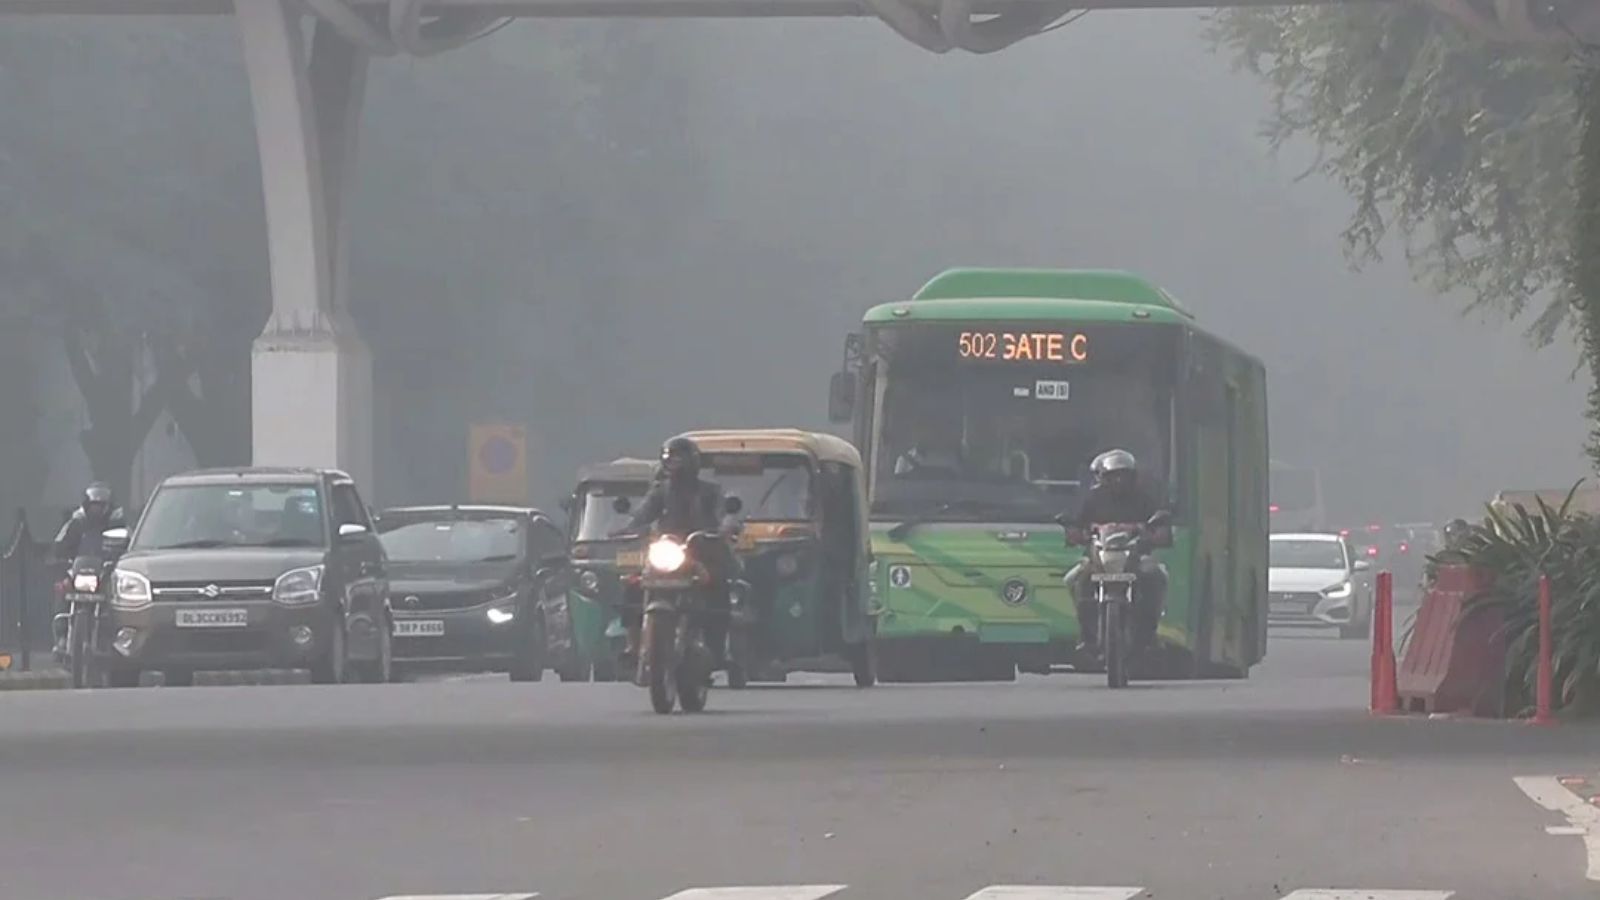
Even as the Commission for Air Quality Management (CAQM) invoked Stage I of the Graded Response Action Plan (GRAP) in Delhi-NCR on October 21, around one-third of Delhi’s PM2.5 pollution in the final week of October came from local sources, according to an analysis of the Indian Institute of Tropical Meteorology (IITM) data by The Indian Express.
Despite restrictions in place, open waste burning, road dust and construction activity were among the key contributors to the air pollution in the region during October’s last week, reveals the analysis of the IITM’s source-apportionment data for a 30-day period from October 13.
The elevated contribution came before the city witnessed a shift and stubble burning and Diwali emissions began dominating the Capital’s pollution profile in early November.
Short-lived respite likely
On Saturday, as Delhi’s air quality remained in the ‘Very Poor’ category, biomass burning, including stubble burning and the use of domestic solid fuels such as wood and dung cake, accounted for the largest share of the PM2.5 pollution at 25.5%, according to IITM estimates.
The Capital’s daily-average Air Quality Index (AQI) on Saturday was recorded at 367 while Noida and Gurugram reported AQIs of 318 and 340, respectively, also in the ‘Very Poor’ category’, as per data maintained by the Central Pollution Control Board (CPCB).
A brief improvement in air quality is expected on Sunday, according to forecasts by IITM, aided partly by the possibility of light rain in isolated parts of the city. However, the respite may be short-lived, with pollution expected to build up again from Monday onwards, particularly during night-time and early morning hours.
Contribution from local sources
The CAQM had invoked the first stage of the pollution restrictions on October 21, mandating stricter action against open waste burning and mechanised road sweeping, among other measures. Yet the contribution of open waste burning increased after the order kicked in, according to the IITM data, accounting for as much as 15% of Delhi’s daily PM2.5 load between October 26 and October 29.
Story continues below this ad
During the same period, road dust, soil and mineral matter contributed roughly 18% of particulate pollution.
Construction-related emissions also rose after the October 21 restrictions, reaching a peak of around 8% of the total PM2.5 burden during the final week of October, immediately before the Delhi government’s ban on construction activities came into force on November 1.
Together, road dust and open waste burning accounted for nearly one-third of Delhi’s PM2.5 pollution during the period, before crop-residue burning and Diwali-related firecracker emissions clearly became the dominant contributors.
Pollution profile shift in November
After the state government’s restrictions under the Winter Action Plan took effect on November 1, followed by the NCR-wide construction ban imposed by CAQM on November 5 and the invocation of GRAP Stage III on November 6, the relative share of construction dust to PM2.5 saw a decline.
Story continues below this ad
IITM data showed its share ranged between 1% and 3% from November 1 onwards.
By the time CAQM implemented GRAP Stage II measures on November 2, the Capital’s pollution profile had also begun shifting from predominantly local sources towards regional and episodic contributors, the IITM data showed.
The contribution of crop-residue burning increased steadily through early November, peaking at 30% of Delhi’s PM2.5 load on November 4, four days before Diwali.
An important caveat is that IITM’s source-apportionment estimates are expressed as percentage shares of Delhi’s real-time PM2.5 load with each source representing its contribution to the overall pollution burden on a given day rather than its absolute concentration. Consequently, a decline in the percentage share of local sources does not necessarily indicate an equivalent drop in their emissions.
Story continues below this ad
During major pollution episodes, high-intensity sources can substantially increase the total PM2.5 load and thereby reduce the relative share of other sources. For instance, firecracker emissions accounted for an estimated 71% of Delhi’s PM 2.5 load on November 9, while secondary organic aerosols contributed 29% on November 11, reducing the proportional contribution of baseline local sources.
Current mix
On Saturday, apart from biomass burning, contributing about 25.5% to Delhi pollution load, secondary organic aerosols contributed 23.6%, followed by vehicular emissions at 17.4%. Waste burning accounted for 6.8% of the pollution load, while mineral dust and ash contributed 1.5%.
Meanwhile, data from the Indian Agricultural Research Institute showed that 11,342 paddy-residue burning incidents were detected between September 15 and November 13, around 27% lower than the 15,492 incidents recorded during the same period last year. Punjab accounted for 5,785 incidents, the highest among all states, though still its second-lowest seasonal tally since 2020. Haryana, Uttar Pradesh, Uttarakhand, and Madhya Pradesh recorded their lowest cumulative counts for the period since 2020, while Rajasthan’s tally remained above levels seen during 2020–23.
KioskNews shows a cleaned-up reading view extracted from the publisher’s page — the original always lives on their site, not ours.