Delhi’s AQI is 370, but some platforms show 1,000: Why do readings differ?
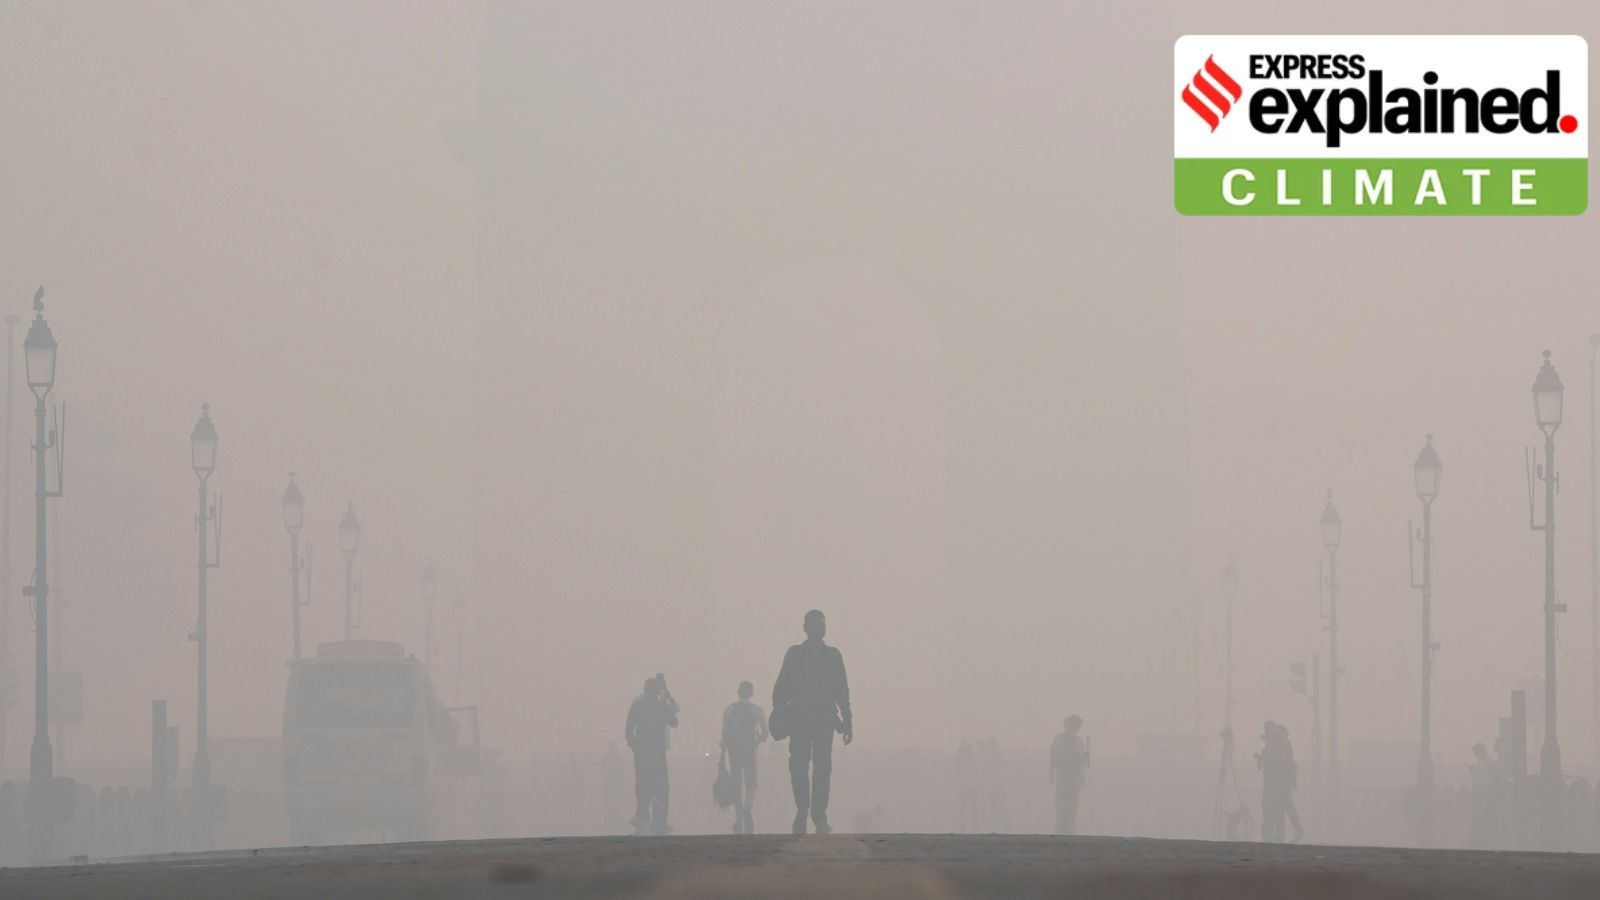
Several monitoring stations in Delhi recorded ‘severe’ air quality on Monday (November 9), a day after Diwali festivities were marked by widespread use of firecrackers despite Supreme Court-mandated restrictions.
A thick layer of smog engulfed several parts of the city, reducing visibility on Monday morning. While Delhi’s overall AQI remained in the ‘very poor’ category, several monitoring stations recorded readings above 400, the threshold for ‘severe’ air quality. Some private monitoring platforms reported substantially higher readings, although differences in AQI scales and measurement methods mean these figures cannot be directly compared.
Over the years, The Indian Express has extensively reported on and explained Delhi’s worsening air pollution, from the factors driving seasonal spikes to how air quality is measured and the measures taken to tackle it. This article brings together those explainers to provide a one-stop guide to understanding the Air Quality Index (AQI), its impact on health, and the restrictions imposed under the Graded Response Action Plan (GRAP).
What is the AQI and how is it calculated?
AQI is a number which measures air quality. The higher the AQI, the worse the air.
The AQI used in India was launched in 2014 as part of the government’s Swachh Bharat campaign. The colour-coded index helps explain the condition of the air and the measures necessary to mitigate the situation depending on its severity.
The index converts measurements of up to eight major air pollutants into a single number, category and colour. These include particulate matter (PM2.5 and PM10), nitrogen dioxide, sulphur dioxide, ozone, carbon monoxide, ammonia and lead.
Each pollutant’s concentration is converted into a separate sub-index based on established health-related thresholds. The highest sub-index determines the overall AQI, rather than an average of all pollutants.
Story continues below this ad
There are six categories of AQI, namely ‘Good’ (0-50), ‘Satisfactory’ (51-100), ‘Moderate’ (101-200), ‘Poor’ (201-300), ‘Very Poor’ (301-400), and ‘Severe’ (401-500).
Why do private platforms show much higher AQI readings than government agencies?
While the Central Pollution Control Board (CPCB) recorded Delhi’s 24-hour average AQI at 370 on Monday morning, private monitoring platform AQI.in reported a reading of 955 under US standards and 787 under its Indian-standard calculation. How can the readings differ so dramatically?
The difference lies partly in how the index is calculated. India’s official AQI uses a scale that stops at 500, while some international platforms use different thresholds for pollutant concentrations and allow readings to exceed 500.
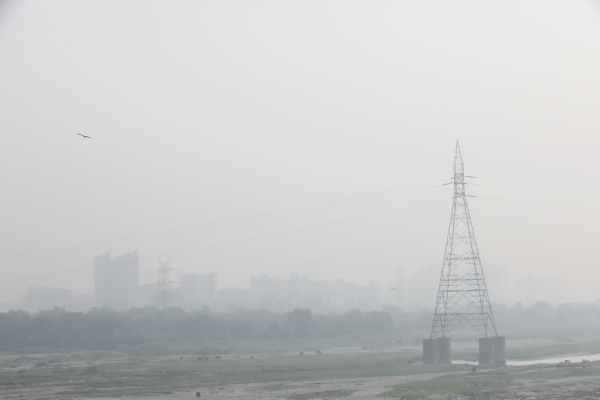 Pollution and visibility post Diwali in Noida and Delhi on Monday, November 9, 2026. Express photo by Abhinav Saha
In November 2024, atmospheric scientist Gufran Beig explained that AQI values are calculated using breakpoints, or thresholds at which pollution moves from one category to another. India’s thresholds differ from those used by some international platforms, meaning the same underlying pollution data can produce different AQI values.
Story continues below this ad
Beig also questioned India’s decision to cap its AQI at 500, regardless of how much pollutant concentrations exceed that level. This means that an official reading of 500 does not necessarily indicate that pollution has stopped increasing. The actual concentration of harmful particles could continue to rise without a corresponding increase in the reported index.
However, differences in AQI scales do not explain every discrepancy. Platforms may also use different monitoring locations, averaging periods and measurement methods.
But how reliable are the measurements themselves? Click here to read how Delhi’s air quality monitoring stations work, and why their readings can sometimes falter.
What is the impact of these pollutants?
Among the more harmful pollutants are fine particles such as PM2.5, which have a diameter of 2.5 micrometres or less, roughly 3% of the width of a human hair.
Story continues below this ad
These particles can penetrate deep into the lungs and enter the bloodstream, increasing the risk of respiratory and cardiovascular illnesses. Prolonged exposure has been linked to conditions such as asthma, chronic bronchitis, heart disease and stroke. Particulate pollution also reduces visibility, contributing to the smog seen across Delhi.
Delhi’s winter pollution is driven by several factors, including vehicle emissions, construction dust, industrial activity and seasonal crop-residue burning. Cooler temperatures, weaker winds and atmospheric conditions that prevent pollutants from dispersing can make matters worse, as Sophiya Mathew explained in October.
How does the AQI influence government policy?
In Delhi-NCR, rising pollution levels trigger progressively stricter measures under the Graded Response Action Plan (GRAP), implemented by the Commission for Air Quality Management (CAQM). The four stages correspond to different AQI ranges, although authorities can invoke measures in advance based on forecasts of worsening air quality
Stage III of GRAP has been in force across Delhi-NCR since Friday (November 6), when the city’s AQI stood at 382, in the ‘very poor’ category, and forecasts indicated further deterioration.
Story continues below this ad
The restrictions include curbs on non-essential construction and demolition activities, a ban on BS-III petrol and BS-IV diesel four-wheelers in Delhi and specified NCR districts, and hybrid classes for children up to Class V, subject to applicable exemptions. Measures introduced under Stages I and II also continue.
Stage IV, which can be invoked when Delhi’s AQI exceeds 450 or forecasts indicate that it will, introduces further restrictions, including tighter curbs on truck entry and school attendance. It has not been invoked in the current episode as of Monday morning.
For more on how GRAP works and the restrictions imposed at each stage, read our earlier explainer.
Can Delhi learn from China’s experience in tackling air pollution?
Story continues below this ad
While GRAP imposes emergency restrictions when pollution levels rise, tackling Delhi’s air pollution requires sustained measures to reduce emissions at their source.
China offers one example. After facing severe air pollution in the 2000s, the country introduced stricter industrial emission controls, cleaner heating systems and measures to expand electric public transport. Research has linked these interventions to significant improvements in air quality.
However, differences in governance, energy access and sources of pollution mean India cannot simply replicate China’s approach. Click here to read Rishika Singh’s explainer on how China tackled air pollution and the lessons India can draw from its experience.
KioskNews shows a cleaned-up reading view extracted from the publisher’s page — the original always lives on their site, not ours.