South Korea shares test 200-day moving average for first time in 17 months

Jae Young Ju/iStock via Getty Images
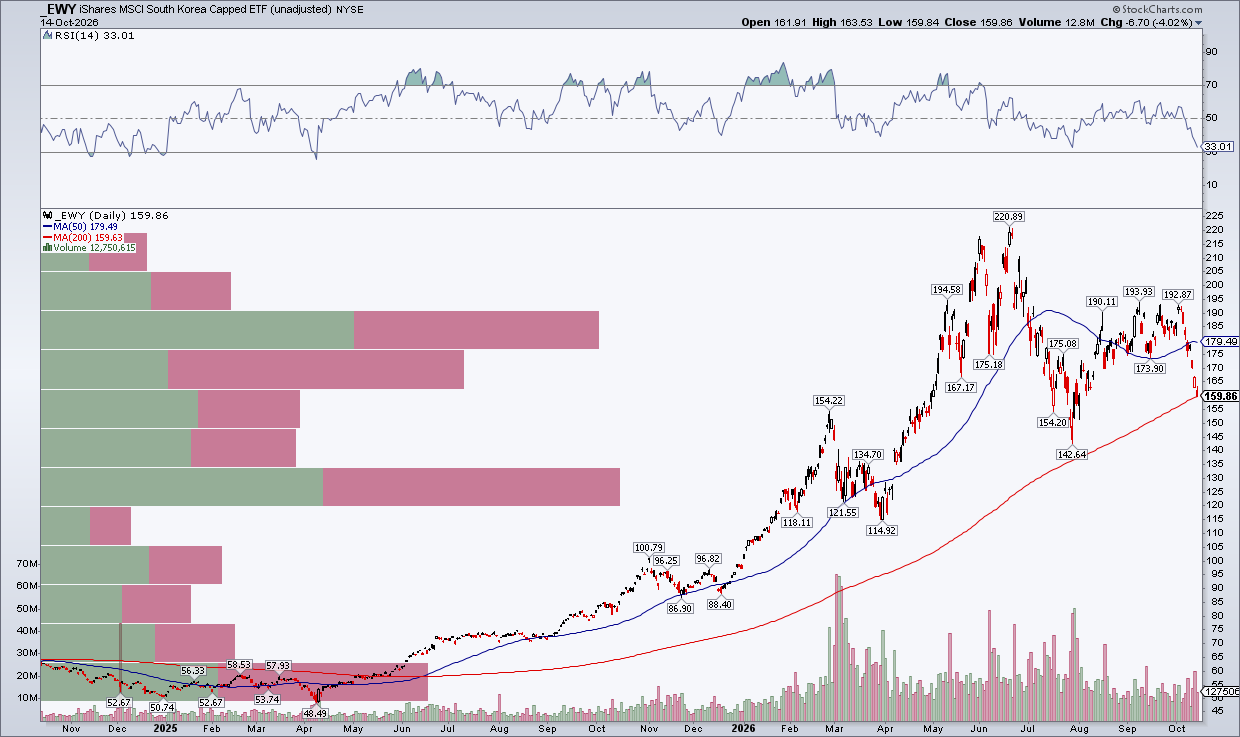
The iShares MSCI South Korea Capped ETF (EWY) tested its 200-day moving average on Wednesday for the first time in 17 months, according to Mike Zaccardi, as renewed pressure on technology stocks and concerns over AI valuations weighed on South Korean equities.
“Lots of dead bodies above today's price too,” Zaccardi wrote on X, referring to the price levels above the ETF’s current trading level.
EWY fell 4.02% to $159.83 on Wednesday, finishing just above its 200-day moving average at $159.63. The ETF remained below its 50-day moving average at $179.49, while its relative strength index was 33.01, approaching oversold territory.
The decline came as South Korean equities faced renewed selling pressure amid concerns over AI valuations and financing costs. South Korea’s market fell 8.34% to around 5,540, extending its losing streak to seven sessions and reaching its lowest level since late July.
The chart showed substantial trading volume at price levels above EWY’s current price, which could present resistance if the ETF attempts to recover.
Here is the chart:
StockChart.com
Recommended For You


Register for free to keep reading.
Create a free account to get unlimited breaking news and alerts when your stocks move.
KioskNews shows a cleaned-up reading view extracted from the publisher’s page — the original always lives on their site, not ours.