Why is Singapore’s central region registering the worst air quality during this year’s haze?
SINGAPORE - Singapore has been experiencing hazy conditions for over a week since air quality in the central region first dipped to unhealthy levels on Sept 4.
Since then, the central region has consistently registered the highest Pollutant Standards Index (PSI) and PM2.5 readings in the five regions used for air quality monitoring – north, south, east, west and central.
The PSI is a measure of air quality in Singapore, and readings of over 100 reflect unhealthy air quality.
Under such conditions, healthy people should reduce prolonged or strenuous outdoor activities, while those with chronic heart and lung disease should avoid such activities.
PM2.5 readings refer to concentrations of fine particulate matter that is the dominant pollutant during periods of transboundary haze.
For instance, the PSI in central Singapore reached a high of 154 at daybreak on Sept 15. Other regions registered readings of between 104 and 128 at that time.
At 5pm on the same day, the PSI in the central region dropped slightly to 133. The west and east regions also recorded unhealthy air, with the values between 114 and 116, while the PSI in the north and south dipped to moderate levels at 92 and 94 respectively.
The central region includes the Thomson, Marymount, Sin Ming, Ang Mo Kio, Bishan, Serangoon Gardens, MacRitchie and Toa Payoh areas, according to the website of the National Environment Agency.
Koh Tieh Yong, an adjunct associate professor in meteorology and climate science at NUS, told The Straits Times that this is because the area is highly urbanised and surrounded by more buildings.
Urban heat from concrete structures heat up the air above the ground, causing hot, rising air parcels that enhance air turbulence.
As winds carry the PM2.5 particles from the forest fires in Indonesia to Singapore, the pollutants are caught more efficiently by the turbulent air in the central region, causing them to concentrate over the area, and close to the ground, he added.
If thicker haze blows over Singapore, the whole island would reach unhealthy air quality or worse, added Koh.
This was seen on the morning of Sept 15, when all parts of Singapore registered unhealthy air – the first time this has occurred since 2019.
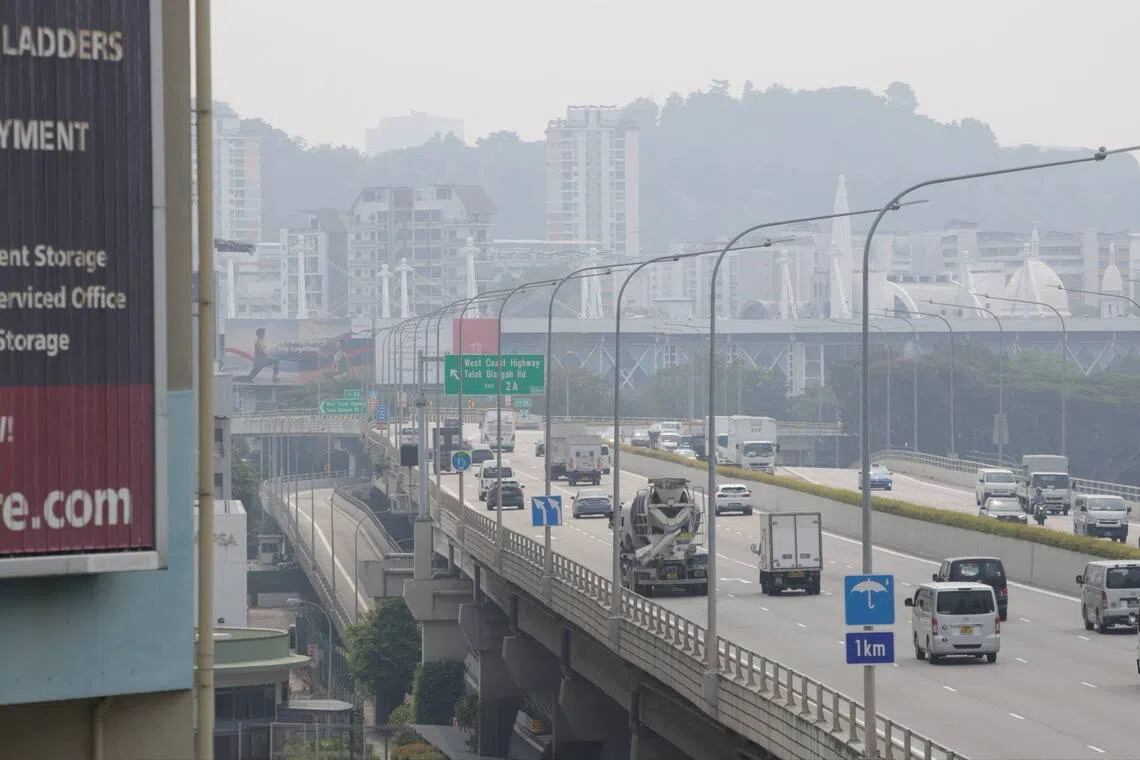
Hazy conditions seen from Tanjong Pagar Distripark towards Bukit Purmei and Mount Faber at 3.02pm on Sept 15.
ST PHOTO: JASEL POH
Steve Yim, professor and director of the Centre for Climate Change and Environmental Health at NTU, added that the higher PSI in central region could be because of the dry conditions in Singapore.
Under such dry conditions, the particles can be from both haze and local emissions or pollutants in the downtown area, he said.
Separately, the National Environment Agency (NEA) said in a Facebook post on Sept 15 that while Singapore has referenced the US Environmental Protection Agency’s Air Quality Index (AQI) system in computing its PSI, they are not identical.
It added: “There are no international guidelines on the computation of air quality index. Each country adopts a different index system based on local needs and circumstances.”
“Air quality readings or indices provided by other websites adopt other methods of computing the index and are not comparable with the 24-hr PSI,” the agency said. “They may also rely on a combination of low-cost, less robust sensors and published data to make their calculations.”
For instance, local website IQAir uses data from NEA and seven private contributors to churn our the air quality index and PM2.5 value in Singapore.
NEA’s post comes as some social media users have been comparing Singapore’s PSI readings with the AQI found on other websites such as aqicn.org.
The AQI readings often reflect poorer air quality in Singapore than the 24-hour PSI, which is Singapore’s official national reporting system for air quality.
The PSI is calculated based on six different pollutants – small particulate matter PM10 and PM2.5, sulphur dioxide, nitrogen dioxide, ozone and carbon monoxide.
The NEA said Singapore’s air quality data is measured by pollutant analysers, which continuously measure the level of the six pollutant types.
“These analysers, placed across the five regions of Singapore, are highly specialised equipment, based on internationally recognised methods,” NEA said. “This is to ensure measurements are reliable and scientifically robust.”
KioskNews shows a cleaned-up reading view extracted from the publisher’s page — the original always lives on their site, not ours.